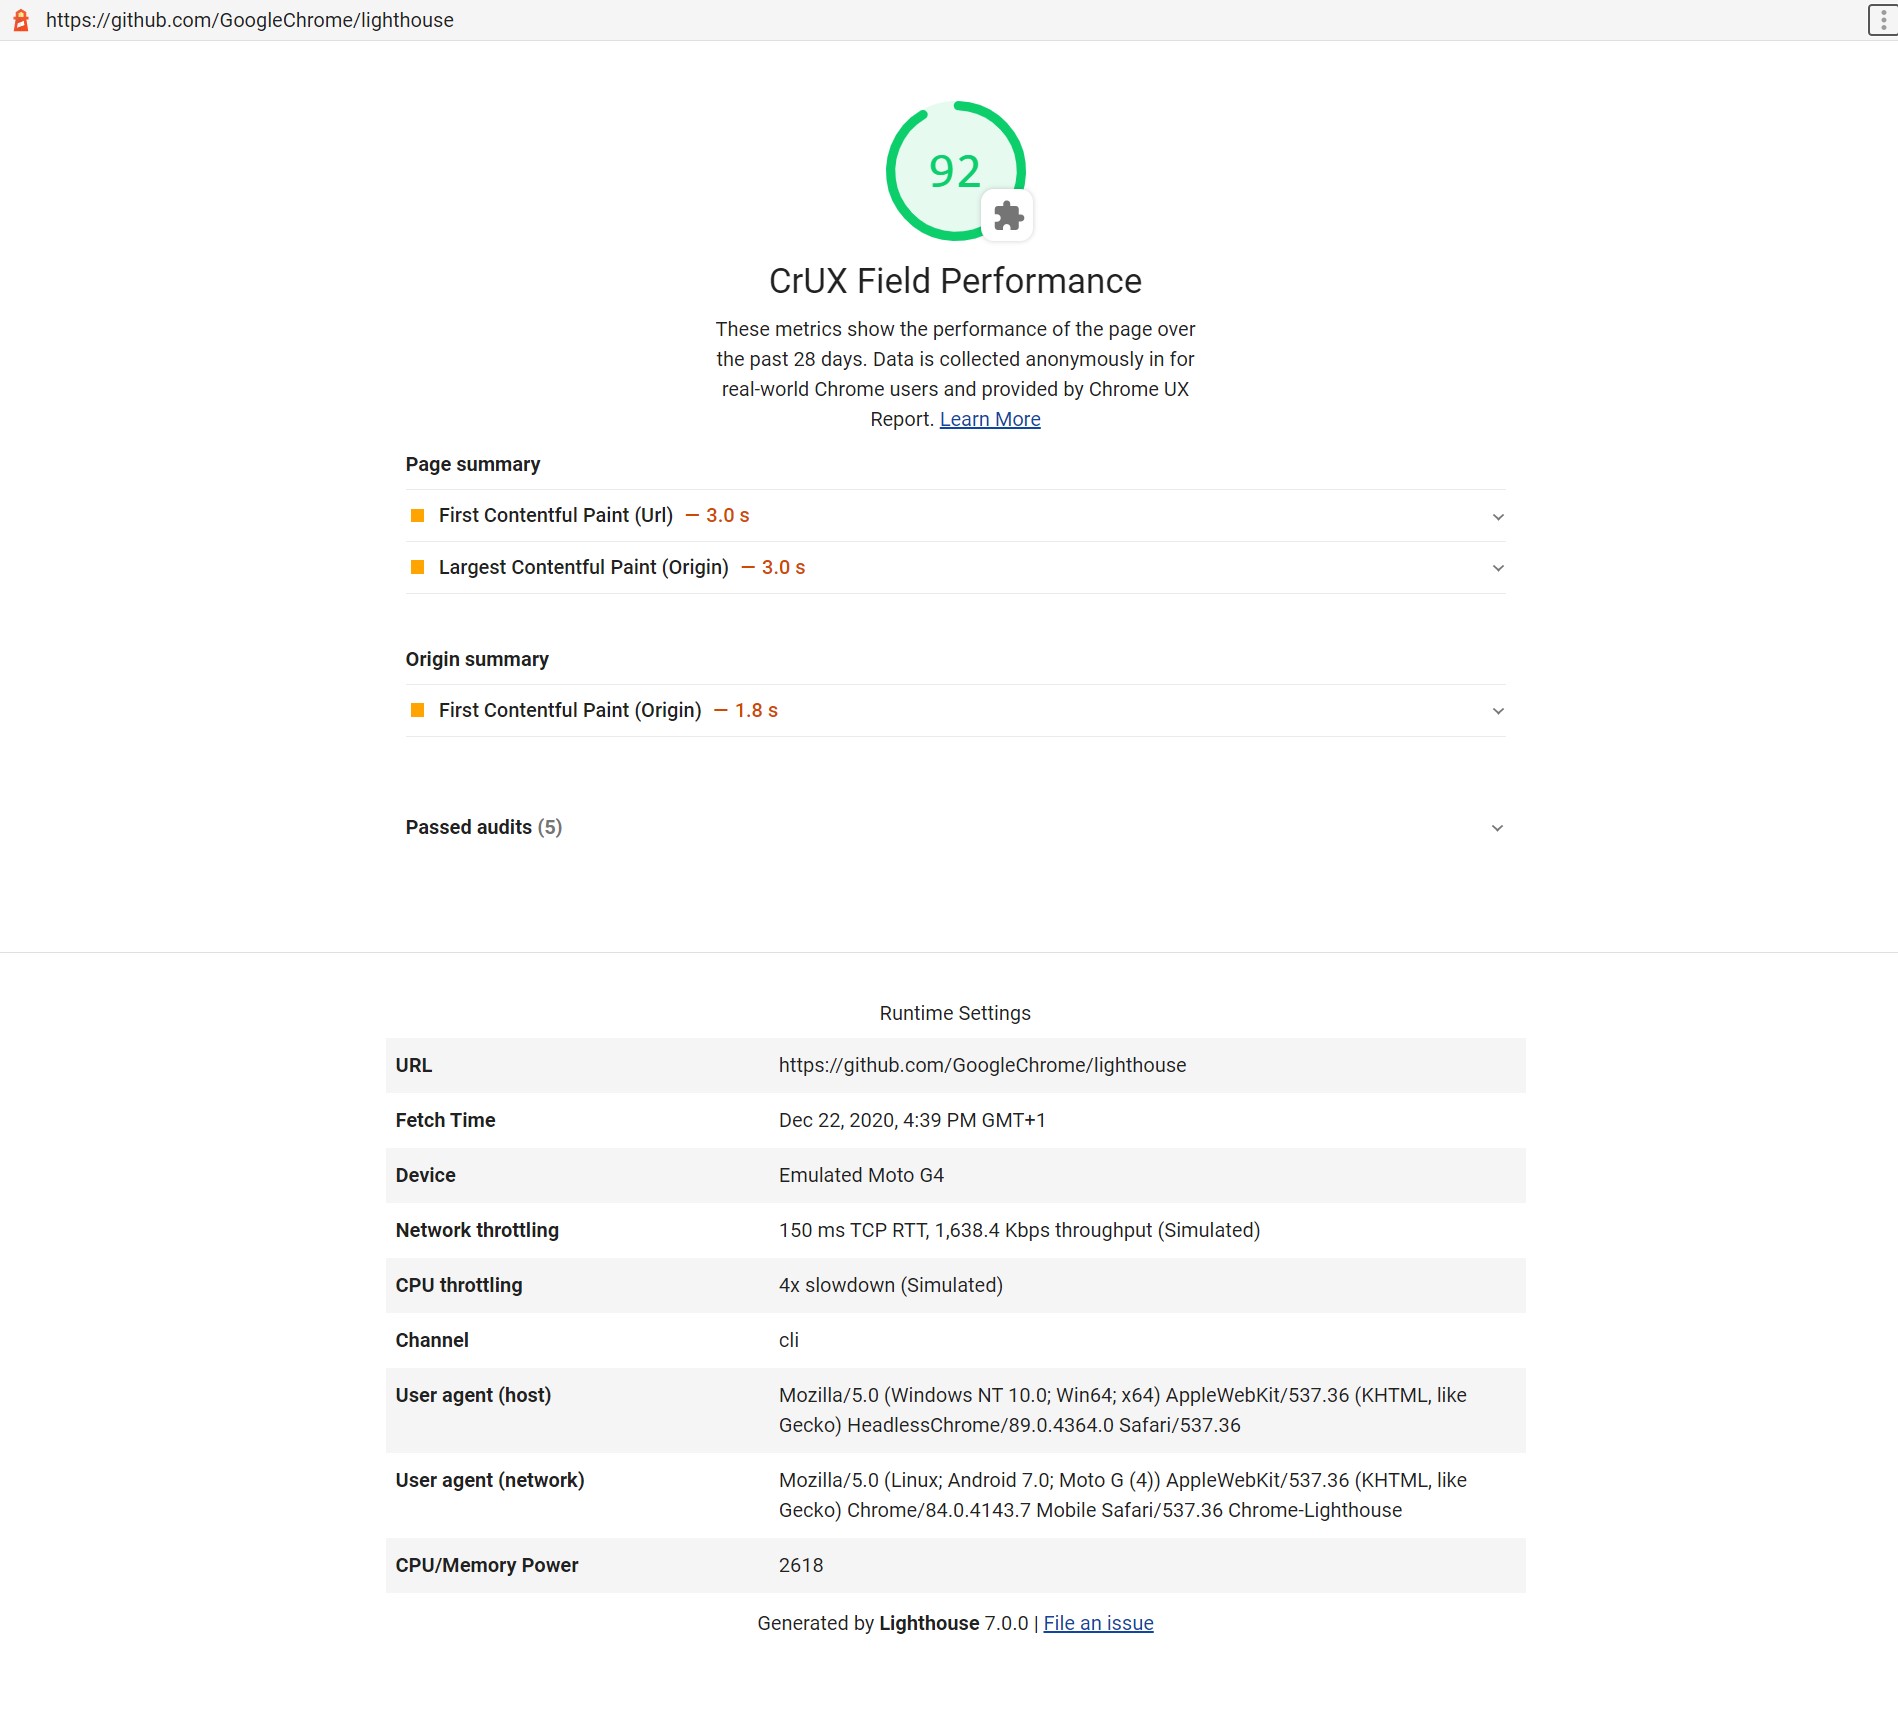
lighthouse-plugin-crux is a custom Lighthouse plugin that enhances your performance audits by incorporating real-world field data from the Chrome UX Report (CrUX) and Core Web Vitals. This plugin provides a more comprehensive view of your website’s performance by combining lab data (from Lighthouse) with field data (from real users).
Motivation
While Lighthouse provides valuable insights into lab-based performance, it doesn’t always reflect the actual experience of your users. At the time, there was another plugin, lighthouse-plugin-field-performance, that aimed to address this by using the PageSpeed Insights API. However, this approach had a significant drawback: it required a full Lighthouse analysis to fetch the field data, resulting in slow response times (often exceeding 30 seconds).
To overcome this limitation, I created lighthouse-plugin-crux. Instead of relying on PageSpeed Insights, it directly integrates with the Chrome User Experience Report (CrUX) API. This allows for much faster retrieval of field data (typically under 1 second) without the overhead of an additional Lighthouse analysis.
Key Features
- CrUX Integration: Fetches and displays relevant CrUX data for your website, including Core Web Vitals metrics (LCP, FID, CLS).
- Enhanced Performance Analysis: Combines lab data with field data to provide a more complete picture of performance.
- Actionable Insights: Helps identify areas where real-world performance may differ from lab results, allowing you to prioritize optimizations.
- Easy to Use: Simple installation and configuration process.
- Fast and Efficient: Retrieves CrUX data quickly without requiring a full Lighthouse analysis.
Technology Stack
- Node.js: JavaScript runtime environment
- Lighthouse: Google’s open-source performance auditing tool
- Chrome UX Report API: Provides access to real-world performance data
Challenges
- Data Handling: Efficiently fetching and processing CrUX data within the Lighthouse audit lifecycle.
- Visualizing Results: Presenting the combined lab and field data in a clear and informative way.
Lessons Learned
- The value of real-world data: Integrating CrUX data provides crucial context for understanding and interpreting lab-based performance results.
- The importance of data visualization: Presenting complex performance data in a user-friendly manner enhances understanding and facilitates decision-making.
- Optimizing for efficiency: Choosing the right API and data retrieval methods can significantly impact performance.
Links
- GitHub Repository: https://github.com/dvelazquez/lighthouse-plugin-crux
- NPM Package: https://www.npmjs.com/package/lighthouse-plugin-crux
Acknowledgements
I would like to thank the Lighthouse team at Google for their work on creating a flexible and extensible performance auditing tool. I also appreciate the efforts of the CrUX team for providing valuable real-world performance data.
Thanks to the creators of lighthouse-plugin-field-performance for their plugin, which inspired the creation of lighthouse-plugin-crux.